Bye bye MY water by 2011
-
[quote]Originally posted by lionnoisy:
[b]It is confirmed now that SG can forgo importing MY water in 2011!!
But of course,SG will not do so!!
yah, sure. i remembered the water dried up in all the water catchment areas before. pls remember that we cannot control nature. solve that with all the numbers you have.
i surely makes a lot of sense to me if the pipe is there because any system that cannot afford any down time in the engineering field has a cost effective back up.
examples, U P S in the server rms, electric generators in big buildings.
i still do not think that the water is going to be charged at a reasonable rate to me. water can ferry a man but can also drown a man..... -
2.Good question.Answers:Originally posted by tim482:hmm if Sg popluation reach to 6.5 million will SG
have enough water resources to Survive ?
Pl read postings here.
--Catchment may grow to 90% of sg land if Variable
Salination method success..
--Recent R & D with Netherland may drop cost
of NEWater by 20 %. -
NEWater and desalination etc are urgent tasks
to replace MY water.
19 of some 180 MY rivers are dead.Penang’s toxic Juru and Pinang rivers — which were among those the national campaign was supposed to help save — are today as dead as ever, still classified as "uninhabitable by all living creatures". It is a dubious honour that could, if left unchecked, easily extend beyond the other 18 dead rivers in the country.
--www.nst.com.my/Current_News/NST/Thursday/Columns/20070426083958/Article/index_html
2.(Natural Resources and Environment Minister Datuk Seri Azmi Khalid)Azmi said the failure of the campaign was evident in the increase in river pollution with 17 rivers having water that was unsafe for humans to even touch.
---http://www.nst.com.my/Current_News/NST/Wednesday/National/20070425075700/Article -
GDP increases some 30 % per m3 per day from 2002 to 2006!
The projection of increases one third in 10 years seem not valid.
Sales of potable water decreases in a row of 3 years.,
when population increases and GDP also up!!!!
year....................2002......03.........04.......05......06
Water treated..1,315...1,360....1,369.....1352...1399( m3 in 1000/day)
Sale of potable...1,259...1,224...1,203....1206...1230(m3..in 1000/day)
water
Domestic...............687......690......686.....694..702( m3 in 1000/day)
Non--domestic.......572......534......517.....512...508( m3 in 1000/day)
population(m)......4.17.....4.19.....4.24....4.35...4.48
sale of potable water in liters/capita/ /day
...........................302(2002)....................275(2006)
GDP
162,491million(2002)............ 209,679million(2006)
GDP per m3 /day $353(2002)........$467 per m3/day click me
Note the huge drop in non--dom water most likely
replaced by NEWater and industral water.
Sale of NEWater..81,000m3/day
Sale of Industrial Water..112,000m3/day
Volume of used water treated....1,399,000 m3/day
Water Demand : Domestic water consumption per capita
162,160,158 liters /capita for 2004,2005,2006
source of water soldKey ENV data 2007
2.Nano-material filters could cut cost of cleaning waterSINGAPORE: The cost of filtering and recycling water could be reduced in a few years' time due to a new material developed by Nanyang Technological University (NTU) and the Public Utilities Board (PUB).
05.June .2007
This was revealed at an international water conference here, called the International Water Association Conference and Exhibition on Water and Wastewater Technologies.
The material that is being engineered by researchers from NTU and the PUB uses nanotechnology, which controls matter on a scale smaller than 1 micrometre, and is made up of nano-sized crystals.
And because the crystals are so tiny, they are able to capture a large amount of unwanted matter in the water.
That is why the nano-material works better than conventional cleaning filters or membranes.
Associate Professor Darren Sun, School of Civil and Environmental Engineering, NTU, said: "Conventional polymer membrane is just a filter. But this new technology will make the filter double up as a reactor which will be able to destroy unwanted material."
The nano-material destroys unwanted matter like dissolved salts and chemical compounds in water by using ultraviolet light and visible light.
The material then clears its surface to allow more unwanted material to collect.
The final goal, which will take a few years, is to make a cleaning filter or membrane out of the nano-material.
The focus now is on testing the material and possibly removing one stage of the pre-treatment of waste and sea water.
Researchers said another objective of the new filter is to prolong the lifespan of the membrane and reduce costs.
For now, the results of tests conducted are promising.
To date, the filter can remove at least 20 percent more organic carbon which is one of the parameters to assess cleaner water.
The PUB estimates that a pilot plant could be built to test the nano-material at Chua Chu Kang Waterworks in about two years and the research project may apply to a scheme called Fast-Tech to fast-track water projects.
Also announced at the conference is the S$300,000 Lee Kuan Yew Water Prize, which recognises organisations or individuals who come up with solutions to water problems.
Nominations will open from the end of June.
The winner will be announced next March and presented in June at the first Singapore International Water Week.
- CNA/so -
SG aims to reduce energy in SEAWATER DESALINATION!
EWI LAUNCHES CHALLENGE CALL FOR INNOVATIVE TECHNOLOGIES IN SEAWATER DESALINATION
Another mission impossible turn into possible.
i read that NUS or NTU already in later stage of research
in ST.
Challenge Call For Innovative Technologies In The Domain Of Seawater Desalination
water water everywhere.Land Land everywhere.
Look at Marina East and South(where casino will be built)In this RFP, the challenge is for applicants to come up with innovative desalination technologies that use 1.5 kilowatt-hour (kWh) or less energy per cubic metre of freshwater produced from seawater. This is more than 50% reduction of the energy requirements which the current advanced seawater desalination technologies use.
2.http://www.spower.com.sg/show that 1.5 kWh is around 10 singapore cents.Pl correct me if wrong.
3.5 Jun 2007Scientists from NTU's School of Civil and Environmental Engineering and Stanford University-- have developed what could be the next big thing in water treatment -- self-cleaning membranes -- a technology that saves almost 90 per cent of the energy used in conventional water treatment methods.
click me.
4.water hub,literally
Jim_Rogers--co-founder, along with George Soros, of the Quantum Fund,said recently,21 or 22 july 2007,on Channel News Asia interview,that Singapore
is the Silicon Valley of water technology etc..
http://www.jimrogers.com/
i must declare his conflict of interest in selling SG!!
He ,his wife and his lovely few years old daughter are
permanent residence of Spore.
He has short listed SG as his home in Asia,among few cities
in PRC,but not Hong Kong.He is selling his mansion
in US.Any one interested? -
It seems we can say bye bye to imported water in 2011
New Changi NEWATER plant will make SG almost need not
import water!!
A 50 mgd (million gallon per day) or 227,000 m3
NEWATER plant will be ready by 2010.
Before desalination and NEWATER
Local water 50%
MY water 50%
After desalination and NEWATER
Local 50%
Desalination 10% for few years already
NEWATER 30% ,by 2010.
Total local water 90 %.
Note:SG water catchment area will increase from 50 % of main island
to two-third area by 2011 when Marina Reservoir is completed.
This has not been factored in the above estimation.
1.Common wisdom is half of SG water imported from MY
before NEWater and desalination water running in our pipes.
This figure is secret lah.
1.1 NEWATER already met 15 % of all SG demand,''The combined capacities of the four NEWater plants already meet 15 percent of SingaporeÂ’s water demand, a target originally set to be met by 2010. ''-
''With this new plant at Changi and the expansion of the Kranji and Bedok NEWater plants, the total capacity will meet about 30 percent of our total water demand by 2011.''----PUB 4 September 2007 press release.
Note:SG daily demand is about 300,000,000 gallon [UK] = 1 363.827 megaliter=
1.36 million m3 or 1,360,000 cubic meter.
www.onlineconversion.com/volume.htm
1.2 Desalination
some 135,000 m3 or 10% of daily need.
By 2010.NEWATER provide 30% and desalination 10%
for daily demand.
Local water already provide some 50%,total make up 90%
of daily demand.
It is interesting that our sales of potable water is dropping
TREND OF WATER DEMAND
year....................2002......03.........04.......05......06
Water treated..1,315...1,360....1,369.....1352...1399( m3 in 1000/day)
Sale of potable...1,259...1,224...1,203....1206...1230(m3..in 1000/day)
water
Domestic...............687......690......686.....694..702( m3 in 1000/day)
Non--domestic.......572......534......517.....512...508( m3 in 1000/day)
population(m)......4.17.....4.19.....4.24....4.35...4.48
sale of potable water in liters/capita/ /day
...........................302(2002)....................275(2006)
GDP
162,491million(2002)............ 209,679million(2006)
GDP per m3 /day $353(2002)........$467 per m3/day click me
Note the huge drop in non--dom water most likely
replaced by NEWater and industral water.
Sale of NEWater..81,000m3/day(BY 2011,MAX CAPACITY IS 450,000M3)
Sale of Industrial Water..112,000m3/day
Volume of used water treated....1,399,000 m3/day
Water Demand : Domestic water consumption per capita
162,160,158 liters /capita for 2004,2005,2006
source of water soldKey ENV data 2007 -
Lets yam shing again with NEWATER!!!

''Compared to the eight-inch system, the 16-inch reverse osmosis membrane takes up 25 per cent less space and saves up to 15 per cent of the annual operating costs for the reverse osmosis system.''
It is the world's first. While the international water industry has been eagerly awaiting the development of the 16-inch reverse osmosis membrane, PUB became the first in the world to use it in water reclamation works....
''This new membrane technology was successfully developed by GrahamTek Singapore, a homegrown water company, last year.''
2.Water, water, everywhere.
Text & pics: Sean Woods, Popular Mechanics
Tue, 07 Jun 2005
''William Graham, founder of GrahamTek Systems. Sean Woods''
3.it is not a home grown co.''GrahamTek is an international company actively involved in the development...'' -
It is (almost )sure SG can forgo all MY water in 2011!!
50 % of SG water CAME from JB.It can be and will be
replaced by the followings.
Pl be patient and read my previous postings in this thread.
With the completion of 5th and largest Changi NEWater Plant providing 50 mgd(million gallon per day) in 2010,
''NEWater will meet 30% of SingaporeÂ’s current water needs by 2010, doubling the original target of 15%.''
Current sale of potable water,pl read this thread 05.Jun 2007.
2.The best kept secret in SG until few years ago is
only half of water come from JB!!
I can say more than 70 % of sG people think SG rely
very much on JB water.Mates,it WAS 50%!!
Half of SG water demand come from MY
before completions
of desalination and NEWater plants.
50% of demand of potable can now be replaced by:
30 % of SG demand: NEWater when Changi NEWater Plant
................................. completed in 2010.15% currently.
10% of SG demand: Desalination Plant was completed.
10% of SG demand:from increase of catchment area fr half of SG to two-third.
.........(Complete in circa 2011.assume new catchment of 100 km2 not so effective.But May be .............more effective)
8% of SG demand: from intergration of reservoirs est completion 2010.
??% of SG demand:from variable salinity plant which is in large scale demonstration levelIf successful, it can potentially increase the water catchment area in Singapore from 67 per cent to 90 per cent.
let say also not so effective,
say 15 % of SG demand.
Total new sources range from 58% to 73% to replace 50% from MY!!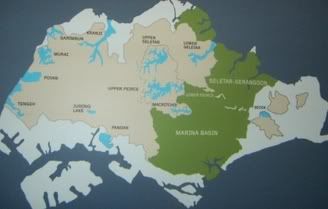
Beige in color is current water catchment area.
Green is water catchment area of proposed Reservoirs
of Marina,Sg Puggol ,Sg Serangoon and and Lower Seletar.
All the new and extended
reservoirs will be ready in 6 years .
Variable salinity plant, which is in large scale demonstration ,
can turn mixture of river water and sea water into potable water!!
This will increase water catchment area to 90% of land!!
