Cost of electricity to go up from April as oil prices rise
-
They are making profit from the natural gases??
-
This is stupid lah. I look forward to seeing the three power plants foreign owners financial reports.
-
-
Originally posted by maurizio13:
Where is your proof?
Conjectures or lies again?
Not sure who is lying.
http://www.med.govt.nz/templates/MultipageDocumentTOC____23939.aspx -
Originally posted by TCH05:
You don't have the intellect to interpret the 2 graphs?You superimpose the 2 graphs together, you see that the price of oil is always increasing,
whereas the price of natural gas is decreasing when oil is increasing.
Do you understand the meaning of correlated?
You prove my point.
Thanks.
-
Originally posted by maurizio13:
You don't have the intellect to interpret the 2 graphs?You superimpose the 2 graphs together, you see that the price of oil is always increasing,
whereas the price of natural gas is decreasing when oil is increasing.
Do you understand the meaning of correlated?
You prove my point.
Thanks.
The pricing formula for LNG is
PLNG = A+B×PCrudeOil
That my friend is how they are correlated.
If they are not coorelated, then how can the shape of the charts over the years look so identical?
-
Originally posted by TCH05:
The pricing formula for LNG is
PLNG = A+B×PCrudeOil
That my friend is how they are correlated.
First of all, I am not sure if Liquified Natural Gas is the same as Natural Gas.I did some research in Wikipedia, it said
Liquefied natural gas or LNG is natural gas that has been converted to liquid form for ease of storage or transport. Liquified natural gas takes up about 1/600th the volume of natural gas at a stove burner tip. It is odorless, colorless, non-corrosive, and non-toxic. When vaporized, it burns only in concentrations of 5% to 15% when mixed with air. Neither LNG, nor its vapor, can explode in an unconfined environment.
The natural gas fed into the LNG plant will be treated to remove water, hydrogen sulfide, carbon dioxide and other components that will freeze (e.g., benzene) under the low temperatures needed for storage or be destructive to the liquefaction facility. LNG typically contains more than 90% methane. It also contains small amounts of ethane, propane, butane and some heavier alkanes. The purification process can be designed to give almost 100% methane.
Second, the link you provided gives the pricing formula, after calculating the prices, you need to plot on the graph.
The 2 graphs you showed us clearly has no correlation at all, when price of oil is going up, the price of natural gas was going down.
What kind of correlation is that?
-
Originally posted by maurizio13:
First of all, I am not sure if Liquified Natural Gas is the same as Natural Gas.I did some research in Wikipedia, it said
The natural gas fed into the LNG plant will be treated to remove water, hydrogen sulfide, carbon dioxide and other components that will freeze (e.g., benzene) under the low temperatures needed for storage or be destructive to the liquefaction facility. LNG typically contains more than 90% methane. It also contains small amounts of ethane, propane, butane and some heavier alkanes. The purification process can be designed to give almost 100% methane.
Second, the link you provided gives the pricing formula, after calculating the prices, you need to plot on the graph.
The 2 graphs you showed us clearly has no correlation at all, when price of oil is going up, the price of natural gas was going down.
What kind of correlation is that?
Liquefied natural gas or LNG is natural gas that has been converted to liquid form for ease of storage or transport. Liquified natural gas takes up about 1/600th the volume of natural gas at a stove burner tip. It is odorless, colorless, non-corrosive, and non-toxic. When vaporized, it burns only in concentrations of 5% to 15% when mixed with air. Neither LNG, nor its vapor, can explode in an unconfined environment.
My guess is that you only took elementary maths in school, thats why you cant see the coorelationship in both. Maybe to you, everything has to be a straight line graph or else it doesnt make any sense.
And btw, LNG and Natural Gas are the samething, they are only in different form. one is gas while other is liquid. And you can also include your fart as natural gas if you want to argue that they have no coorelationship.
-
deleted
-
Originally posted by TCH05:
The pricing formula for LNG is
PLNG = A+B×PCrudeOil
That my friend is how they are correlated.
If they are not coorelated, then how can the shape of the charts over the years look so identical?
B changes the steepness of the slope of the graph
A changes the vertical displacement of the graph.
PLNG = A+B×PCrudeOil
is not the equation of correlation at all. Who are you trying to kid? -
I took a few minutes to superimpose the two graphs together for everyone:

-
Originally posted by eagle:
B changes the steepness of the slope of the graph
A changes the vertical displacement of the graph.
PLNG = A+B×PCrudeOil
is not the equation of correlation at all. Who are you trying to kid?
Please dont distort our discussion EAGLE.From the above equation,
a) Is price of LNG related to Price of Crude Oil?
b) When there is a positive rise in price of crude oil and A&B remain unchanged, will price of LNG goes up or down?
-
Originally posted by eagle:
I took a few minutes to superimpose the two graphs together for everyone:
wow...that is so impressive.
And what is your comment? No coorelationship?
-
Originally posted by TCH05:
Please dont distort our discussion EAGLE.From the above equation,
a) Is price of LNG related to Price of Crude Oil?
b) When there is a positive rise in price of crude oil and A&B remain unchanged, will price of LNG goes up or down?
Am I even discussing with you about that issue? I'm merely pointing out to everyone that you are trying to pull a wrong and unrelated equation into this thread just to support your argument.
If you want to support your argument, at least support it with the right things, not bring in a wrong and unrelated equation in a bid to support your argument.
Somehow, for question a, I still wonder why when you are still trying to use your unrelated equation to ask others to explain a relation.
-
Originally posted by TCH05:
wow...that is so impressive.
And what is your comment? No coorelationship?
I'm not going to comment. I'm putting it out for everyone to see since maurizio said something about superimposing the two graphs. If you want to find any correlation, you can take some time with the graphs to extract some values, calculate the covariance and deviations, and derive the correlation factor.
-
Originally posted by eagle:
Am I even discussing with you about that issue? I'm merely pointing out to everyone that you are trying to pull a wrong and unrelated equation into this thread just to support your argument.
If you want to support your argument, at least support it with the right things, not bring in a wrong and unrelated equation in a bid to support your argument.
Eagles, please dont simply distort my post here and twist what I posted here.
PLNG = A+B×PCrudeOil is the pricing formular use by Asian LNG market, not some academic equations you learn in school.
Please think deeper before making comments.
-
Originally posted by TCH05:
Eagles, please dont simply distort my post here and twist what I posted here.
PLNG = A+B×PCrudeOil is the pricing formular use by Asian LNG market, not some academic equations you learn in school.
Please think deeper before making comments.
Pls go back to elementary mathematics, and pls show where I distorted your post. I'm pointing out that your this statement is rubbish:
That my friend is how they are correlated.
They may use that pricing, but it is definitely not a proof of correlation. Do you have any idea how the equation above can change the graph and values of PLNG as compared to crude oil to very uncorrelated?
You definitely fail O level statistics.
Wonder who is the one who is not thinking deep now. Can't even understand simple O level maths on graphs.
-
Originally posted by eagle:
Pls go back to elementary mathematics, and pls show where I distorted your post. I'm pointing out that your this statement is rubbish:
They may use that pricing, but it is definitely not a proof of correlation. Do you have any idea how the equation above can change the graph and values of PLNG as compared to crude oil to very uncorrelated?
You definitely fail O level statistics.
Wonder who is the one who is not thinking deep now. Can't even understand simple O level maths on graphs.
You know what is your problem?
I think you ara real attention seeker and the reason why you twisted what I said is because you want to diverti this discussion to talk about mathamatic equation, so that you can show off what you have just learn in the university.
The purpose of our discussion is to argue weather there is a coorelationship between LNG price and Oil price, not which mathamatic equation is more suitable for studying coorelationship.
Please lah...dont always try to show off what you know...it really make me sick.
-
Originally posted by TCH05:
You know what is your problem?
I think you ara real attention seeker and the reason why you twisted what I said is because you want to diverti this discussion to talk about mathamatic equation, so that you can show off what you have just learn in the university.
The purpose of our discussion is to argue weather there is a coorelationship between LNG price and Oil price, not which mathamatic equation is more suitable for studying coorelationship.
Please lah...dont always try to show off what you know...it really make me sick.
Yawns... Someone who cannot accept that he is wrong is trying to kid others again.
1) You cannot even show us which post I made that I have twisted what you have said. Words said without being substantiated.
2) You want to use a unrelated equation taught in O levels and tell us some cock and bull story, then tell me that it is something learned in university? You are also trying to tell me that I'm showing off knowledge that is taught at O levels? Sounds like you didn't even pass O levels maths to say this.

3) You want to tell me I diverted when I'm merely pointing out the main mistake you made. What are you trying to do? Are you trying to divert us away from me showing that the only basis that you have to support your correlation argument is wrong?
So how is pointing out that your flawed basis for your correlation argument not related to your discussion of whether there is a coorelationship between LNG price and Oil price? You fail to make sense here.
This is not the first time you tell others they divert away from arguments when flaws in your posts are pointed out to you.
The joke of the day:
The pricing formula for LNG is
PLNG = A+B×PCrudeOil
That my friend is how they are correlated.
-
Originally posted by TCH05:
Eagles, please dont simply distort my post here and twist what I posted here.
PLNG = A+B×PCrudeOil is the pricing formular use by Asian LNG market, not some academic equations you learn in school.
Please think deeper before making comments.
I learn something today that price of LNG ie
PLNG = A+B×PCrudeOil
is the pricing formular use by Asian LNG market. Thank you.
This clearly shows that once factors A and B are fixed, the price of Crude Oil (PCrudeOil) will affect the PLNG directly. PCrudeOil goes up PLNG will go up by a factor of B (provided B is positive, to which common sense say it is).
This explain that although power plants can be using LNG as fuel but the electricity production cost is always linked to the price of crude oil.
If possible, can you give some idea of the range of factor A and B. Thank you again.
-
sigh
correlated does not mean it ALWAYS moves in tendem. The degree of correlation determines how similar the movement is. Just because it doesn't ALWAYS move together doesn't mean it's not correlated.
But that is irrelavent. Because as the graphs show, the price of natural gas HAS increased in recent months. And that is all that is required to prove my argument that the price hike is indeed justified on the supply side front.
-
a lot of things have gone up.
diet coke 1.5l now 2.10
fried fish balls now 1.20, up 20cts
mei cai ya canned food now 2.40, up 50 cts
there many more......
-
Originally posted by deathbait:
sigh
correlated does not mean it ALWAYS moves in tendem. The degree of correlation determines how similar the movement is. Just because it doesn't ALWAYS move together doesn't mean it's not correlated.
Yep, that's correlation alright. But be careful that TCH condemns you for showing off what you learned in university.

He will tell you again:
The pricing formula for LNG is
PLNG = A+B×PCrudeOil
That my friend is how they are correlated.
-
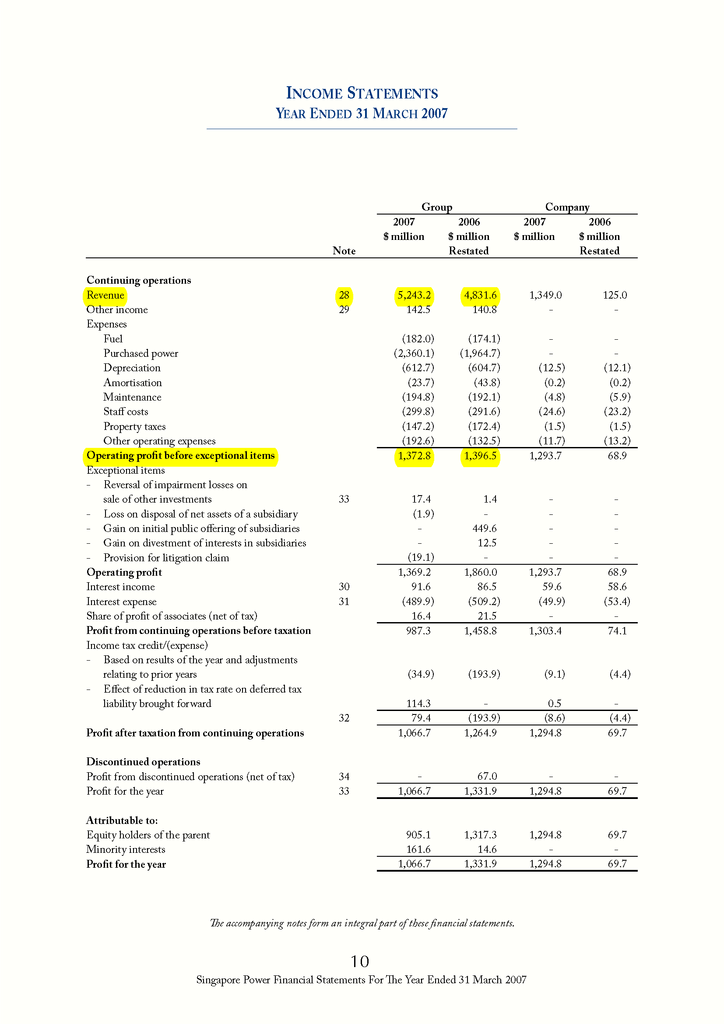
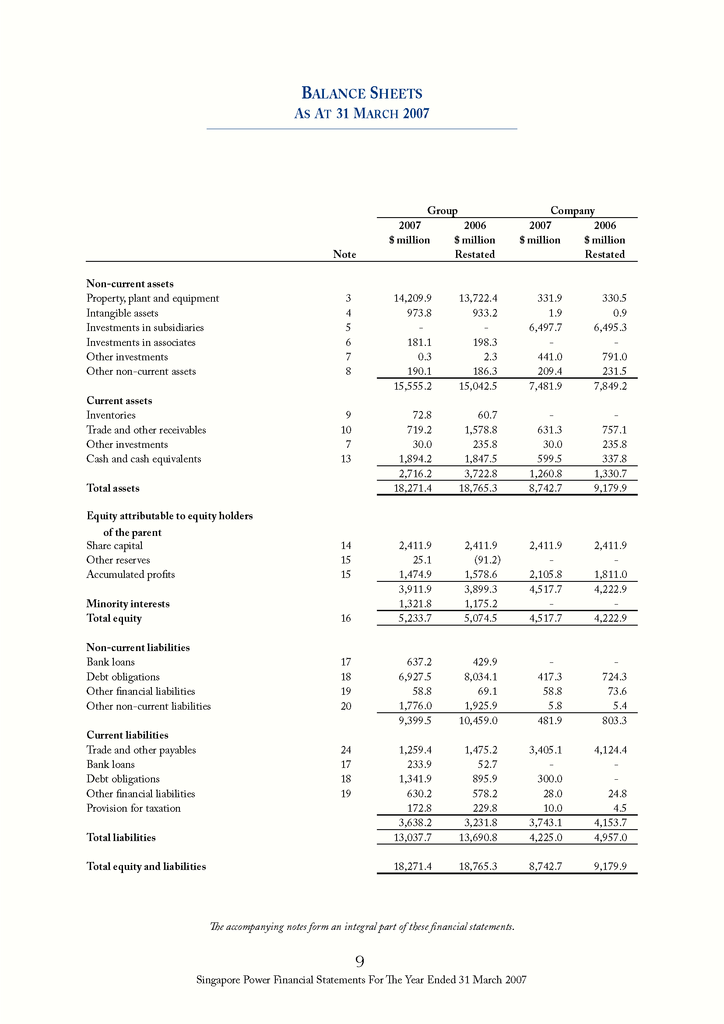
Interesting to note that Singapore Power made SG$1 billion net profit out of sales of SG$5 billion.
Also, the Return on Equity (ROE) for Singapore Power in 2007 was 20.70%,
whereas the industry average for electric companies was around 10%.
El Paso Electric Company only has a ROE of 11.20%.
ROE = Net Income / Average Total Equity
ROA = 1066.7m / 5154.1m = 20.70%
Obviously they haven't been making enough money, that's why they need to increase prices
to make more money.
Maybe they need to recover the cost of our recent failed investments in Merrill Lynch.
For a highly stable industry such as utilities 20% net profit is alot by industrial standards.
http://goliath.ecnext.com/coms2/gi_0199-4442447/Can-diversification-create-value-Evidence.html
http://www.oreilly.com/catalog/onlineinvesthks/chapter/hack30.pdf
-
Banks should be a highly lucrative investment as compared to a utilities company,
but in Singapore's case, there is a role reversal.
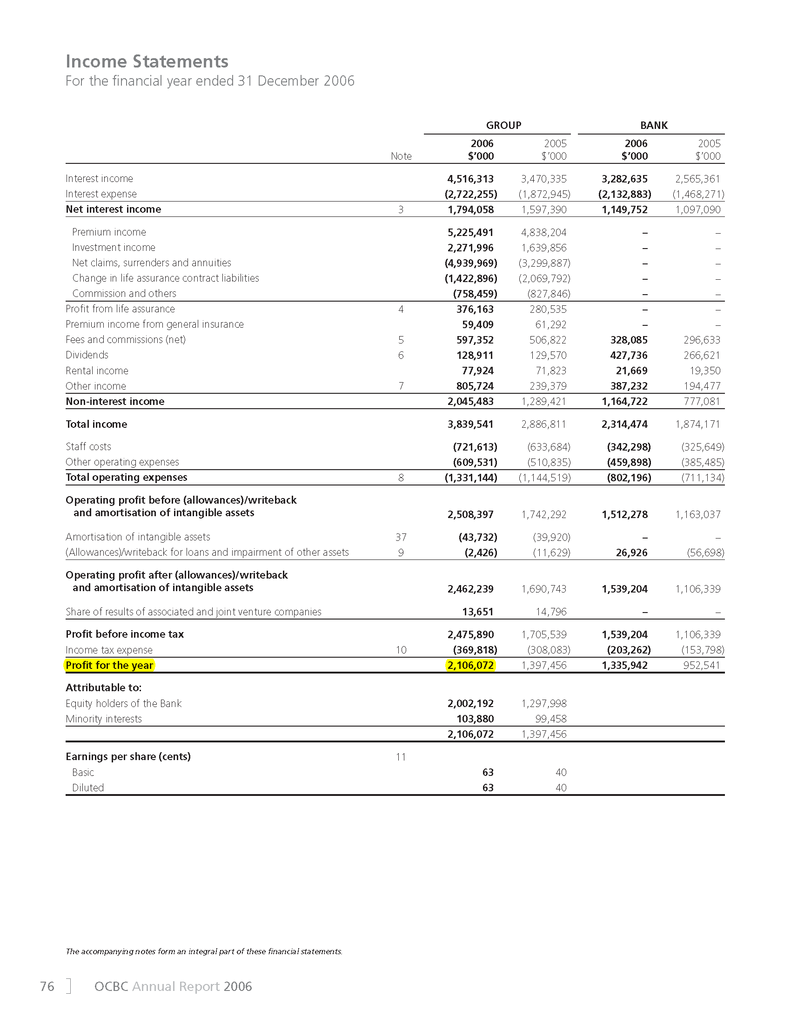
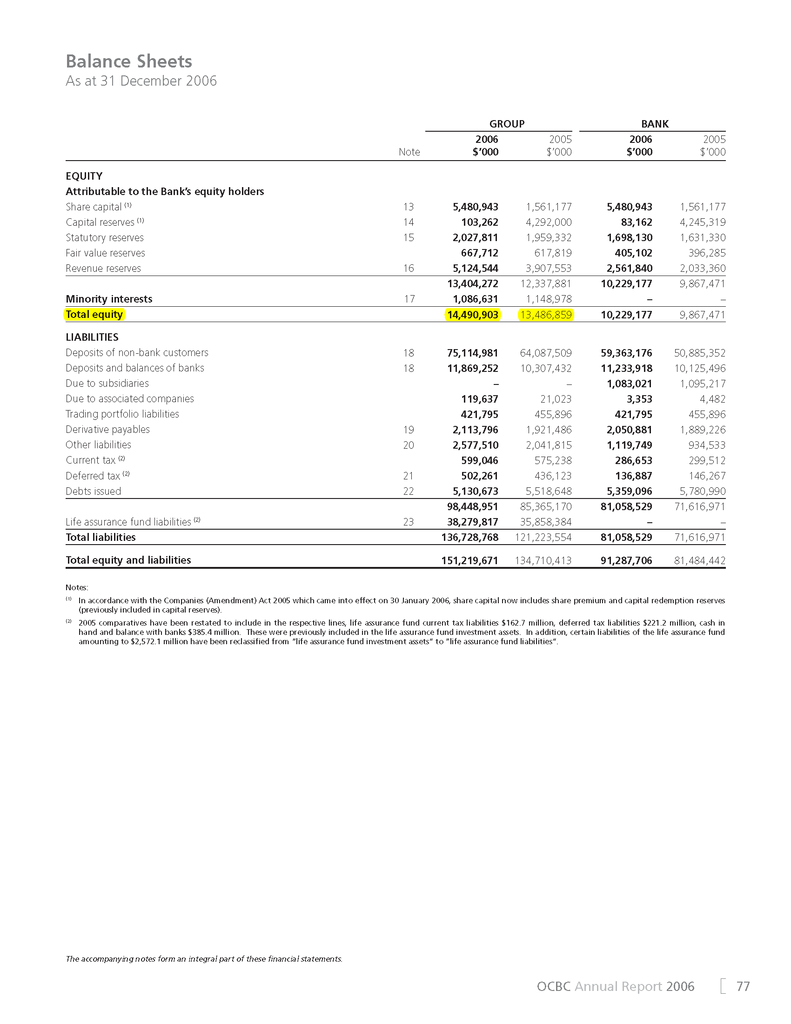
OCBC only managed to generate a ROE of 15.06% for the year ended 2006.
The ROE of OCBC (15.06%) is dwarfed by the ROE of Singapore Power (20.70%).
OCBC's ROE = 2,106,072 / 13,988,881 = 15.06%