Over 30% earn less than $1200?
-
by Leong Sze Hian
 I refer to the Ministry of Manpower’s (MOM) Singapore Workforce 2010 Report ,released on 30 November.
The real nominal median income for all employed residents rose by only 1.1% to $2,500 in 2010. After two consecutive years of negative real income growth in 2009 (- 1.8%) and 2008, six years (2001 to 2006) whereby median income hardly moved, and just one year of significant rise in 2007, the bottom line is that real wage growth for the last 10 years or so, is only about slightly over one per cent per annum.
With inflation running at 3.5% now, and the Minister of State for Trade and Industry’s (MTI) recent announcement in Parliament that inflation is expected to hit 4% by the end of this year, it is likely that workers may see a third consecutive year of negative real wage growth.
The real median monthly income from work of residents in full-time employment only increased by 1.8% to $2,710 in 2010.
Part-timers’ real median monthly income increased significantly by 11% to $700 in 2010.
Since the definition of a part-timer was changed from 2009, from working 30 to 35 hours a week, this increase in income may be due to some extent to more people not being able to get work of more than 35 hours a week.
If someone works seven hours a day, for five days a week, would you consider this worker as a part-timer?
Also, how does one survive on just $700 gross income (which includes the employee’s CPF contribution) a month in Singapore?
In this connection, from 1999 to 2010, the median gross monthly income of part-timers increased by only 1.4% per annum, from $600 in 1999 to $700 in 2010 (not adjusted for inflation yet). If we adjust for inflation, the increase per annum is near to zero.
There were 400,100 residents who earned up to $1,200 and below per month from work, forming 21% of the workforce. This was slightly lower than 401,600 or 22% a year ago.
Why does the MOM keep using the same $1,200 benchmark, year after year, for the last 10 years, without adjusting for inflation.
After adjusting the $1,200 for inflation, I estimate the percentage of residents earning less than $1,200 to be over 25%.
In 2001, 25.1% earned less than $1,200. So, I believe more people today earn less than $1,200 (inflation-adjusted), compared to 9 years ago.
If we include the non-seasonally 4.1% or 84,400 unemployed as of June, and the 10,900 discouraged unemployed, I estimate that over 30% of residents earn less than $1,200 (inflation-adjusted) or are unemployed.
Discouraged workers are persons outside of the labour force who were not looking for a job because they believed their job search would be in vain.
176,700 or 9.0% of employed residents in 2010 were part-timers, up from 156,200 or 8.4% in 2009. Around half or 49% of the part-timers in 2010 were willing and available to work additional hours (i.e. underemployed), down from 52% a year ago.
However, the number of underemployed residents rose from 80,500 or 4.3% of all employed residents to 86,600 or 4.4% over the year.
Once out of work, mature residents were more likely to stay unemployed for extended periods. Close to three in ten (28%) resident job seekers aged 40 & over had been looking for work for at least 25 weeks in June 2010, higher than two in ten (20%) for all job seekers.
Of all the categories of workers, Service & Sales workers had the highest unemployment rate of 5.5%. Even Cleaners, Labourers & Related workers had the third highest unemployment rate of 5.3%.
Aren’t these the jobs that we have been constantly told that Singaporeans don’t want? If so, then why is the unemployment rate so high for these workers?
Does this mean that even Cleaners and Labourers who lost their jobs, had difficulty getting re-employed in the same jobs?
To what extent has our liberal foreign worker policy contributed to this?
In my view, the above statistics clearly indicate that many Singaporeans may not be better off over the last decade or so.
I rest my case.
-
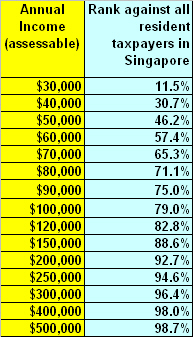
For year 2010
-
if they are so rich....why arent they driving a porsche and taking taxis to werk everyday???
-
Originally posted by eagle:
For year 2010
how accurate are these figures? I take this to be reflective of personal income, and $30,000 equals $2500/month.
It seems that these figures suggests only 11.5% of taxpayers earn below $2.5k/ month. incredible.
and 30.7% earns $40k/yr, or $3.3k/month.
seems abit over-inflated to me, considering that some managers are only earning slightly over 2k, in the f&b and retail industries. lets not mention about the avg rank and file workers who are earning $1000++ /mnth.
-
Originally posted by eagle:
For year 2010
anyone with annual income <30k doesn't need to pay tax and hence not included into calculations
hiding the lower-income citizens doesn't mean they don't exist
-
Originally posted by deathmaster:
how accurate are these figures? I take this to be reflective of personal income, and $30,000 equals $2500/month.
It seems that these figures suggests only 11.5% of taxpayers earn below $2.5k/ month. incredible.
and 30.7% earns $40k/yr, or $3.3k/month.
seems abit over-inflated to me, considering that some managers are only earning slightly over 2k, in the f&b and retail industries. lets not mention about the avg rank and file workers who are earning $1000++ /mnth.
the table shows only those who pay taxes.
-
Wow! So low salary ? How to afford even a new 4-rm HDB ? Perhaps they are living with parents? HDB are so expensive nowadays....
-
So many smart people in sgforums.
Scary.

-
Originally posted by deathmaster:
how accurate are these figures? I take this to be reflective of personal income, and $30,000 equals $2500/month.
It seems that these figures suggests only 11.5% of taxpayers earn below $2.5k/ month. incredible.
and 30.7% earns $40k/yr, or $3.3k/month.
seems abit over-inflated to me, considering that some managers are only earning slightly over 2k, in the f&b and retail industries. lets not mention about the avg rank and file workers who are earning $1000++ /mnth.
Originally posted by Zweiz:anyone with annual income <30k doesn't need to pay tax and hence not included into calculations
hiding the lower-income citizens doesn't mean they don't exist
Obvious segments that aren't representative
1) Those who don’t earn enough to be taxed
2) Those who are too rich to work for an income (they are only taxed on their rental and dividend incomes ($30k?), so it’s not particularly representative.)
3) Those who receive a lot of income from overseas sources, and hence are not taxed in Singapore but from in other countries.
4) Those who under-declare their income
5) Those who masked expenditures into their income (for business owners)
So what is hidden or not? Which of 1, 2, 3, 4, 5 is more? No one will truly know. While those who are really in the lower income bracket and struggling to make a living deserves our attention, there's no point at all to harp and harp only on (1) and claimed that the figures presented are pure propanganda. Complaining on figures and taking true actions for the needy are two different things.
-
Our Government is telling us to live within our means
Cannot afford 4 room, buy 3 room lor. You should be happy you can afford a roof over your head
If you don’t fall within the income group to buy a 3 room flat, than you owe them your ass for 30 years
-
EIther those figures are real or there are plenty of people under declaring their income taxes.
-
Originally posted by eagle:
Obvious segments that aren't representative
1) Those who don’t earn enough to be taxed
2) Those who are too rich to work for an income (they are only taxed on their rental and dividend incomes ($30k?), so it’s not particularly representative.)
3) Those who receive a lot of income from overseas sources, and hence are not taxed in Singapore but from in other countries.
4) Those who under-declare their income
5) Those who masked expenditures into their income (for business owners)
So what is hidden or not? Which of 1, 2, 3, 4, 5 is more? No one will truly know. While those who are really in the lower income bracket and struggling to make a living deserves our attention, there's no point at all to harp and harp only on (1) and claimed that the figures presented are pure propanganda. Complaining on figures and taking true actions for the needy are two different things.
in ts first post, 21% of population earns below $1.2k per month
which of 1, 2, 3, 4, 5 is more? doesn't take a genius to figure out
-
Originally posted by Zweiz:
in ts first post, 21% of population earns below $1.2k per month
which of 1, 2, 3, 4, 5 is more? doesn't take a genius to figure out
How would you know how many percentages are retirees with rental income of $1k a month?
Or to reduce total tax paid, the property income is for the homemaker who stays at home while the other spouse is out there earning big bucks?
How about a early retiree who survives on dividends and rental income, and which only the rental income is taxed because his dividends are from post-tax?
I also have a friend earning $1k+ per month, but married a husband earning $9k+ a month. Both are residents, and go into two different tax brackets. Was this taken into account?
Truth is, such statistics presented by the writer are purely numbers; it is never a true representative of what is on the ground. There's no value at all to make such a simplistic judgment and conclusion about resident's income vs their livelihood purely from tax brackets statistics when there are so many other factors involved that have not been considered.
-
Well, all i know is......those in the lower rung...like delivery drivers, general workers, retail, cleaners, security etc etc; they earned $1200 ten years ago and today, they still earn that kind of salary. Just take a look at the poly grads and you can see. Average entry pay is still $1500. After 10 years, it will still be pretty much the same.
So there goes the big qn: Are we better off since the last elections?
-
Originally posted by eagle:
How would you know how many percentages are retirees with rental income of $1k a month?
Or to reduce total tax paid, the property income is for the homemaker who stays at home while the other spouse is out there earning big bucks?
How about a early retiree who survives on dividends and rental income, and which only the rental income is taxed because his dividends are from post-tax?
I also have a friend earning $1k+ per month, but married a husband earning $9k+ a month. Both are residents, and go into two different tax brackets. Was this taken into account?
Truth is, such statistics presented by the writer are purely numbers; it is never a true representative of what is on the ground. There's no value at all to make such a simplistic judgment and conclusion about resident's income vs their livelihood purely from tax brackets statistics when there are so many other factors involved that have not been considered.
21% of population earns below $1.2k per month
this 21% has nothing to do with your retirees collecting rental income (unless you can find me one rich ah pek who stays in hdb, rents out his condo, and clean kopitiam tables for $600 per month)
workforce report is not your taxation report.
21% of population earns below $1.2k per month means just that.
-
Originally posted by Zweiz:
21% of population earns below $1.2k per month
this 21% has nothing to do with your retirees collecting rental income (unless you can find me one rich ah pek who stays in hdb, rents out his condo, and clean kopitiam tables for $600 per month)
workforce report is not your taxation report.
21% of population earns below $1.2k per month means just that.
There you go....it's no surprise that I see and know many of these folks around. They don't get the 3-5% increment every year. And it's cheaper to hire the guy from china to clean the mall rather than a singaporean.
-
Originally posted by Zweiz:
21% of population earns below $1.2k per month
this 21% has nothing to do with your retirees collecting rental income (unless you can find me one rich ah pek who stays in hdb, rents out his condo, and clean kopitiam tables for $600 per month)
workforce report is not your taxation report.
21% of population earns below $1.2k per month means just that.
Probably you are right about the rental income part. My bad.
For the other parts, I'm too lazy to explain my thoughts further on why it is too simplistic. For all I know, I might be wrong in my understanding too.
Take it as you are correct and I'm wrong. 21% of population earns below $1.2k per month indeed means just that.
I rather enjoy my day than debate about it. Enjoy your day too! :)
-
Originally posted by Demon Bane:
Wow! So low salary ? How to afford even a new 4-rm HDB ? Perhaps they are living with parents? HDB are so expensive nowadays....
I dont actually believe the figures totally.I am sure there are lots of people earning less than $2k per month.
With the cost of living hampering us, $2k per month before cpf is considered low.
Buying a hdb flats is difficult and expensive. Need parents to folk out the 1st payment and thereafter housing loans for years to come.
-
It is true that there are many people who are earning less than $2k per month.
Think about it, there are many "educated" people who falls into the ITE, poly educated level. They make up the majority of the population. And their starting pay is about S$ 1 to 1. 8 K. And they never exceed 3 K in their lifetime, with the current education qualification that they have.
Only a minority, get into university and managed to get a starting salary of S$ 2.5 k per month.
That exclude the older generation who do not received much education.
The cost of living has already overwhelmed the earning income of the young generations. In case, some people are still unaware.
-
Originally posted by Lokey:
It is true that there are many people who are earning less than $2k per month.
Think about it, there are many "educated" people who falls into the ITE, poly educated level. They make up the majority of the population. And their starting pay is about S$ 1 to 1. 8 K. And they never exceed 3 K in their lifetime, with the current education qualification that they have.
Only a minority, get into university and managed to get a starting salary of S$ 2.5 k per month.
That exclude the older generation who do not received much education.
The cost of living has already overwhelmed the earning income of the young generations. In case, some people are still unaware.
I must be the minority :(
-
Originally posted by Lokey:
It is true that there are many people who are earning less than $2k per month.
Think about it, there are many "educated" people who falls into the ITE, poly educated level. They make up the majority of the population. And their starting pay is about S$ 1 to 1. 8 K. And they never exceed 3 K in their lifetime, with the current education qualification that they have.
Only a minority, get into university and managed to get a starting salary of S$ 2.5 k per month.
That exclude the older generation who do not received much education.
The cost of living has already overwhelmed the earning income of the young generations. In case, some people are still unaware.
Some people are still unaware....are those mps. They rely on figures and not on the grounds. -
When they say assessable income $30,000 with a percentage of 11.5%, it just means that those who are taxable in the current income bracket.
Hence you see a monthly figure of $2,500 ($30,000 / 12 months), those who have a monthly salary of under $2,000 don't even need to submit the income tax returns.
The figures for assessable income are all those income earners subjected to tax, not those who earn than $2,000 and don't submit their returns.
-
Should be 13mth right? ($30 000 / 13 mths)
-
Originally posted by deathmaster:
how accurate are these figures? I take this to be reflective of personal income, and $30,000 equals $2500/month.
It seems that these figures suggests only 11.5% of taxpayers earn below $2.5k/ month. incredible.
and 30.7% earns $40k/yr, or $3.3k/month.
seems abit over-inflated to me, considering that some managers are only earning slightly over 2k, in the f&b and retail industries. lets not mention about the avg rank and file workers who are earning $1000++ /mnth.
You're such a fucktard.
The table is inverse, because it calculates where you stand against the rest of the population.
Do you seriously think 98.7% of the pop. earn $500,000 per annum? Or is it someone who earns $500,000 per annum earns more than 98.7% of the pop.?
U very stupid leh. -
Originally posted by likeyou:
Should be 13mth right? ($30 000 / 13 mths)
It doesn't matter. In the professional world, salary packages are calculated annually.